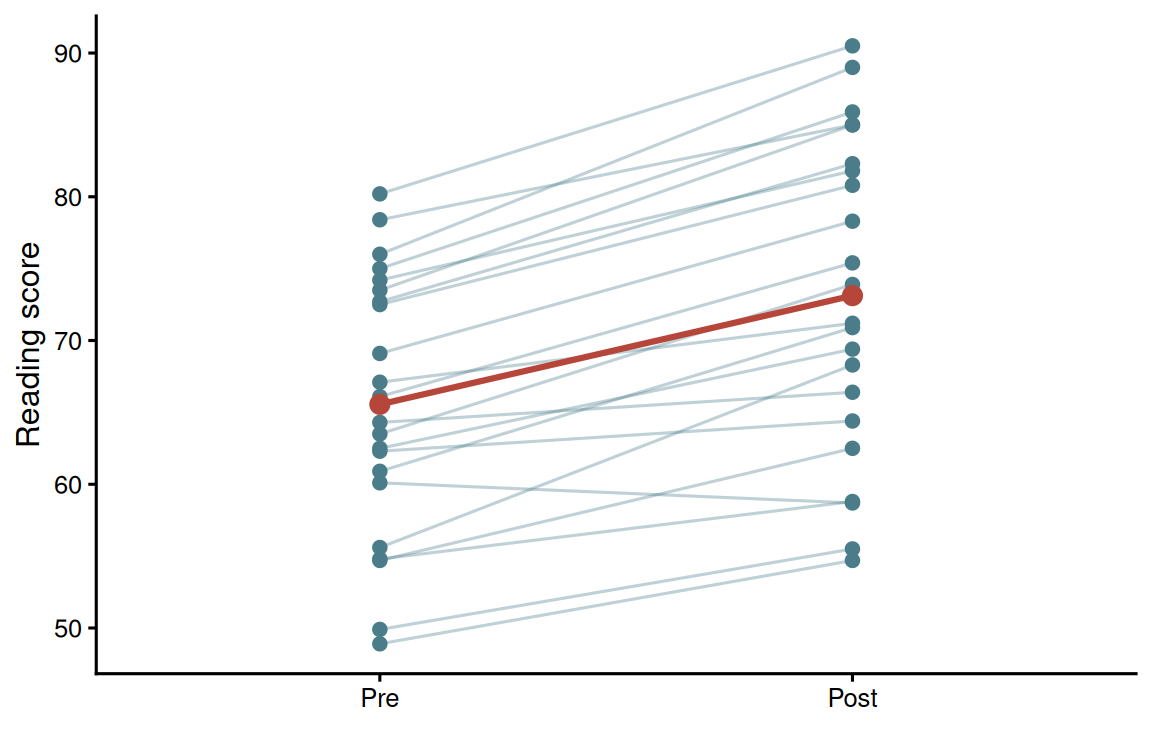
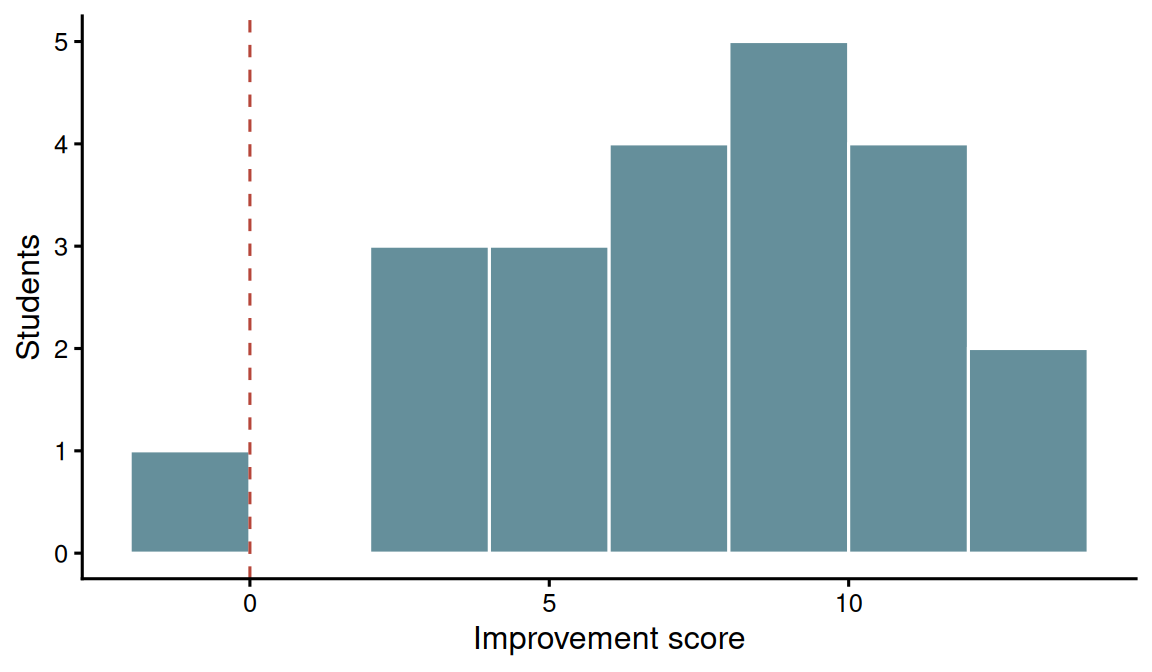
Create a forest plot of mean improvement by grade or teacher using the descriptive summaries in Table P4.3. Add a note explaining why the plot is useful for implementation review but not sufficient for formal subgroup inference.
Ayre, Colin, and Andrew J. Scally. 2014.
‘Critical Values for Lawshe’s Content Validity Ratio: Revisiting the Original Methods of Calculation’.
Measurement and Evaluation in Counseling and Development 47 (1): 79–86.
https://doi.org/10.1177/0748175613513808.
Briggs, Steven R., and Jonathan M. Cheek. 1986. ‘The Role of Factor Analysis in the Development and Evaluation of Personality Scales’. Journal of Personality 54 (1): 106–48.
Buuren, Stef van. 2018. Flexible Imputation of Missing Data. 2nd ed. Boca Raton, FL: Chapman; Hall/CRC.
Cameron, A. Colin, and Pravin K. Trivedi. 2013.
Regression Analysis of Count Data. 2nd ed. Cambridge: Cambridge University Press.
https://doi.org/10.1017/CBO9781139013567.
Chen, Henian, Patricia Cohen, and Sophie Chen. 2010.
‘How Big Is a Big Odds Ratio? Interpreting the Magnitudes of Odds Ratios in Epidemiological Studies’.
Communications in Statistics - Simulation and Computation 39 (4): 860–64.
https://doi.org/10.1080/03610911003650383.
Cicchetti, Domenic V. 1994.
‘Guidelines, Criteria, and Rules of Thumb for Evaluating Normed and Standardized Assessment Instruments in Psychology’.
Psychological Assessment 6 (4): 284–90.
https://doi.org/10.1037/1040-3590.6.4.284.
Clark, Lee Anna, and David Watson. 1995. ‘Constructing Validity: Basic Issues in Objective Scale Development’. Psychological Assessment 7 (3): 309–19.
Cohen, Jacob. 1988. Statistical Power Analysis for the Behavioral Sciences. 2nd ed. Hillsdale, NJ: Lawrence Erlbaum Associates.
Conover, W. J. 1999. Practical Nonparametric Statistics. 3rd ed. New York: John Wiley & Sons.
Costello, Anna B., and Jason Osborne. 2005.
‘Best Practices in Exploratory Factor Analysis: Four Recommendations for Getting the Most from Your Analysis’.
Practical Assessment, Research, and Evaluation 10 (1): 1–9.
https://doi.org/10.7275/jyj1-4868.
Davison, A. C., and D. V. Hinkley. 1997. Bootstrap Methods and Their Application. Cambridge Series in Statistical and Probabilistic Mathematics. Cambridge: Cambridge University Press.
DeVellis, Robert F., and Carolyn T. Thorpe. 2021. Scale Development: Theory and Applications. 5th ed. Thousand Oaks, CA: SAGE Publications.
Dienes, Zoltan. 2014.
‘Using Bayes to Get the Most Out of Non-Significant Results’.
Frontiers in Psychology 5: 781.
https://doi.org/10.3389/fpsyg.2014.00781.
Efron, Bradley, and Robert J. Tibshirani. 1993. An Introduction to the Bootstrap. New York, NY: Chapman; Hall/CRC.
Elm, Erik von, Douglas G. Altman, Matthias Egger, Stuart J. Pocock, Peter C. Gøtzsche, and Jan P. Vandenbroucke. 2007.
‘The Strengthening the Reporting of Observational Studies in Epidemiology (STROBE) Statement: Guidelines for Reporting Observational Studies’.
PLoS Medicine 4 (10): e296.
https://doi.org/10.1371/journal.pmed.0040296.
Fay, Michael P. 2010.
‘Confidence Intervals That Match Fisher’s Exact or Blaker’s Exact Tests’.
Biostatistics 11 (2): 373–74.
https://doi.org/10.1093/biostatistics/kxp050.
Firth, David. 1993.
‘Bias Reduction of Maximum Likelihood Estimates’.
Biometrika 80 (1): 27–38.
https://doi.org/10.1093/biomet/80.1.27.
Gelman, Andrew, Daniel Simpson, and Michael Betancourt. 2017.
‘The Prior Can Often Only Be Understood in the Context of the Likelihood’.
Entropy 19 (10): 555.
https://doi.org/10.3390/e19100555.
Good, Phillip I. 2005. Permutation, Parametric, and Bootstrap Tests of Hypotheses. 3rd ed. New York: Springer.
Graham, John W. 2009.
‘Missing Data Analysis: Making It Work in the Real World’.
Annual Review of Psychology 60: 549–76.
https://doi.org/10.1146/annurev.psych.58.110405.085530.
Hair, Joseph F., G. Tomas M. Hult, Christian M. Ringle, and Marko Sarstedt. 2017. A Primer on Partial Least Squares Structural Equation Modeling (PLS-SEM). 2nd ed. Thousand Oaks, CA: SAGE Publications.
Harrell, Frank E. 2015.
Regression Modeling Strategies: With Applications to Linear Models, Logistic and Ordinal Regression, and Survival Analysis. 2nd ed. Springer Series in Statistics. New York: Springer.
https://doi.org/10.1007/978-3-319-19425-7.
Heinze, Georg, and Michael Schemper. 2002.
‘A Solution to the Problem of Separation in Logistic Regression’.
Statistics in Medicine 21 (16): 2409–19.
https://doi.org/10.1002/sim.1047.
Hodges, Jr., J. L., and E. L. Lehmann. 1963.
‘Estimates of Location Based on Rank Tests’.
The Annals of Mathematical Statistics 34 (2): 598–611.
https://doi.org/10.1214/aoms/1177704172.
Hoenig, John M., and Dennis M. Heisey. 2001. ‘The Abuse of Power: The Pervasive Fallacy of Power Calculations for Data Analysis’. The American Statistician 55 (1): 19–24.
Hosmer, David W., Stanley Lemeshow, and Rodney X. Sturdivant. 2013.
Applied Logistic Regression. 3rd ed. Wiley Series in Probability and Statistics. Hoboken, NJ: John Wiley & Sons.
https://doi.org/10.1002/9781118548387.
Hu, Li-tze, and Peter M. Bentler. 1999.
‘Cutoff Criteria for Fit Indexes in Covariance Structure Analysis: Conventional Criteria Versus New Alternatives’.
Structural Equation Modeling 6 (1): 1–55.
https://doi.org/10.1080/10705519909540118.
Huberty, Carl J., and Stephen Olejnik. 2006.
Applied MANOVA and Discriminant Analysis. 2nd ed. Hoboken, NJ: Wiley.
https://doi.org/10.1002/047178947X.
Hwang, Ching-Lai, and Kwangsun Yoon. 1981.
Multiple Attribute Decision Making: Methods and Applications. Berlin: Springer.
https://doi.org/10.1007/978-3-642-48318-9.
Hyndman, Rob J., and George Athanasopoulos. 2021.
Forecasting: Principles and Practice. 3rd ed. Melbourne, Australia: OTexts.
https://otexts.com/fpp3/.
Koo, Terry K., and Mae Y. Li. 2016.
‘A Guideline of Selecting and Reporting Intraclass Correlation Coefficients for Reliability Research’.
Journal of Chiropractic Medicine 15 (2): 155–63.
https://doi.org/10.1016/j.jcm.2016.02.012.
Kraft, Matthew A. 2020.
‘Interpreting Effect Sizes of Education Interventions’.
Educational Researcher 49 (4): 241–53.
https://doi.org/10.3102/0013189X20912798.
Lakens, Daniël. 2013.
‘Calculating and Reporting Effect Sizes to Facilitate Cumulative Science: A Practical Primer for t-Tests and ANOVAs’.
Frontiers in Psychology 4: 863.
https://doi.org/10.3389/fpsyg.2013.00863.
Lakens, Daniël, Anne M. Scheel, and Peder M. Isager. 2018.
‘Equivalence Testing for Psychological Research: A Tutorial’.
Advances in Methods and Practices in Psychological Science 1 (2): 259–69.
https://doi.org/10.1177/2515245918770963.
Lawshe, Charles H. 1975.
‘A Quantitative Approach to Content Validity’.
Personnel Psychology 28 (4): 563–75.
https://doi.org/10.1111/j.1744-6570.1975.tb01393.x.
Lipsey, Mark W., and David B. Wilson. 1993.
‘The Efficacy of Psychological, Educational, and Behavioural Treatment: Confirmation from Meta-Analysis’.
American Psychologist 48 (12): 1181–1209.
https://doi.org/10.1037/0003-066X.48.12.1181.
Little, Roderick J. A. 1988.
‘A Test of Missing Completely at Random for Multivariate Data with Missing Values’.
Journal of the American Statistical Association 83 (404): 1198–1202.
https://doi.org/10.1080/01621459.1988.10478722.
MacKinnon, David P., Jennifer L. Krull, and Chondra M. Lockwood. 2000. ‘Equivalence of the Mediation, Confounding and Suppression Effect’. Prevention Science 1 (4): 173–81.
Mair, Patrick, and Rand R. Wilcox. 2020.
‘Robust Statistical Methods in r Using the WRS2 Package’.
Behavior Research Methods 52 (2): 464–88.
https://doi.org/10.3758/s13428-019-01246-w.
Mann, Henry B., and Donald R. Whitney. 1947.
‘On a Test of Whether One of Two Random Variables Is Stochastically Larger Than the Other’.
The Annals of Mathematical Statistics 18 (1): 50–60.
https://doi.org/10.1214/aoms/1177730491.
McDonald, Roderick P. 1999. Test Theory: A Unified Treatment. Mahwah, NJ: Lawrence Erlbaum Associates.
Morey, Richard D., and Jeffrey N. Rouder. 2011.
‘Bayes Factor Approaches for Testing Interval Null Hypotheses’.
Psychological Methods 16 (4): 406–19.
https://doi.org/10.1037/a0024377.
Nielsen, Jakob. 1993. Usability Engineering. San Francisco, CA: Morgan Kaufmann.
Olsson, Ulf. 1979. ‘Maximum Likelihood Estimation of the Polychoric Correlation Coefficient’. Psychometrika 44 (4): 443–60.
Opricovic, Serafim, and Gwo-Hshiung Tzeng. 2004.
‘Compromise Solution by MCDM Methods: A Comparative Analysis of VIKOR and TOPSIS’.
European Journal of Operational Research 156 (2): 445–55.
https://doi.org/10.1016/S0377-2217(03)00020-1.
Page, Matthew J., Joanne E. McKenzie, Patrick M. Bossuyt, Isabelle Boutron, Tammy C. Hoffmann, Cynthia D. Mulrow, Larissa Shamseer, et al. 2021.
‘The PRISMA 2020 Statement: An Updated Guideline for Reporting Systematic Reviews’.
BMJ 372: n71.
https://doi.org/10.1136/bmj.n71.
R Core Team. 2026.
R: A Language and Environment for Statistical Computing. Vienna, Austria: R Foundation for Statistical Computing.
https://www.R-project.org/.
Rubin, Donald B. 1987. Multiple Imputation for Nonresponse in Surveys. New York, NY: Wiley.
Saaty, Thomas L. 1980. The Analytic Hierarchy Process. New York, NY: McGraw-Hill.
Schulz, Kenneth F., Douglas G. Altman, and David Moher. 2010.
‘CONSORT 2010 Statement: Updated Guidelines for Reporting Parallel Group Randomised Trials’.
BMJ 340: c332.
https://doi.org/10.1136/bmj.c332.
Shan, Guogen. 2018. Exact Statistical Inference for Categorical Data. London: Academic Press.
Sterne, Jonathan A. C., Ian R. White, John B. Carlin, Michael Spratt, Patrick Royston, Michael G. Kenward, Angela M. Wood, and James R. Carpenter. 2009.
‘Multiple Imputation for Missing Data in Epidemiological and Clinical Research: Potential and Pitfalls’.
BMJ 338: b2393.
https://doi.org/10.1136/bmj.b2393.
Teare, M. Dawn, Munyaradzi Dimairo, Neil Shephard, Amanda Hayman, Amy Whitehead, and Stephen J. Walters. 2014.
‘Sample Size Requirements to Estimate Key Design Parameters from External Pilot Randomised Controlled Trials: A Simulation Study’.
Trials 15: 264.
https://doi.org/10.1186/1745-6215-15-264.
Tomczak, Maciej, and Ewa Tomczak. 2014. ‘The Need to Report Effect Size Estimates Revisited: An Overview of Some Recommended Measures of Effect Size’. Trends in Sport Sciences 21 (1): 19–25.
Trizano-Hermosilla, Italo, and Jose M. Alvarado. 2016.
‘Best Alternatives to Cronbach’s Alpha Reliability in Realistic Conditions: Congeneric and Asymmetrical Measurements’.
Frontiers in Psychology 7: 769.
https://doi.org/10.3389/fpsyg.2016.00769.
Van de Schoot, Rens, and Milica Miočević. 2020. Small Sample Size Solutions: A Guide for Applied Researchers and Practitioners. London: Routledge.
Vehtari, Aki, Andrew Gelman, and Jonah Gabry. 2017.
‘Practical Bayesian Model Evaluation Using Leave-One-Out Cross-Validation and WAIC’.
Statistics and Computing 27 (5): 1413–32.
https://doi.org/10.1007/s11222-016-9696-4.
Wagenmakers, Eric-Jan, Jonathon Love, Maarten Marsman, Tahira Jamil, Alexander Ly, Josine Verhagen, Ravi Selker, et al. 2018.
‘Bayesian Inference for Psychology. Part II: Example Applications with JASP’.
Psychonomic Bulletin & Review 25 (1): 58–76.
https://doi.org/10.3758/s13423-017-1323-7.
White, Ian R., Patrick Royston, and Angela M. Wood. 2011.
‘Multiple Imputation Using Chained Equations: Issues and Guidance for Practice’.
Statistics in Medicine 30 (4): 377–99.
https://doi.org/10.1002/sim.4067.