
Raw-variable distribution panels: histogram, boxplot, and Q-Q
Source:R/plots.R
sframe_plot_variable_distribution.RdUnlike sframe_plot_descriptives(), which summarises skewness and
kurtosis across the variables in a descriptives_report() table, this
operates on one variable's raw values directly (the report table only
stores summary statistics, not the underlying vector), matching the
pattern sframe_plot_correlation_matrix() already uses for
report-independent, data-driven plots.
Usage
sframe_plot_variable_distribution(data, variable, palette = c("web", "print"))Value
A named list of three ggplot2 objects (histogram, boxplot,
qq), or NULL if fewer than two complete values remain.
Examples
# \donttest{
if (requireNamespace("ggplot2", quietly = TRUE)) {
demo <- sframe_demo_data()
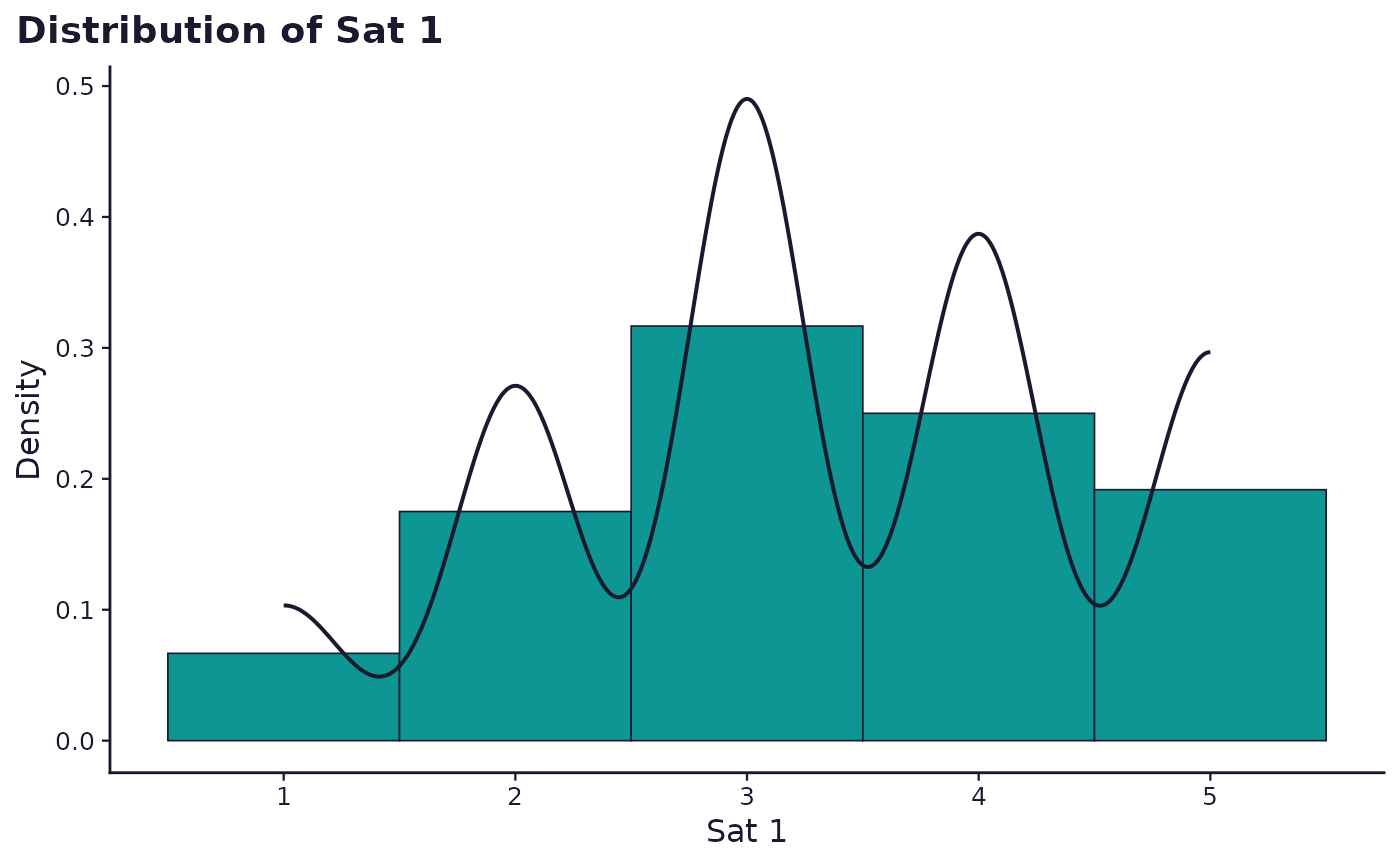
panels <- sframe_plot_variable_distribution(demo$responses, "sat_1")
panels$histogram
}
 # }
# }