
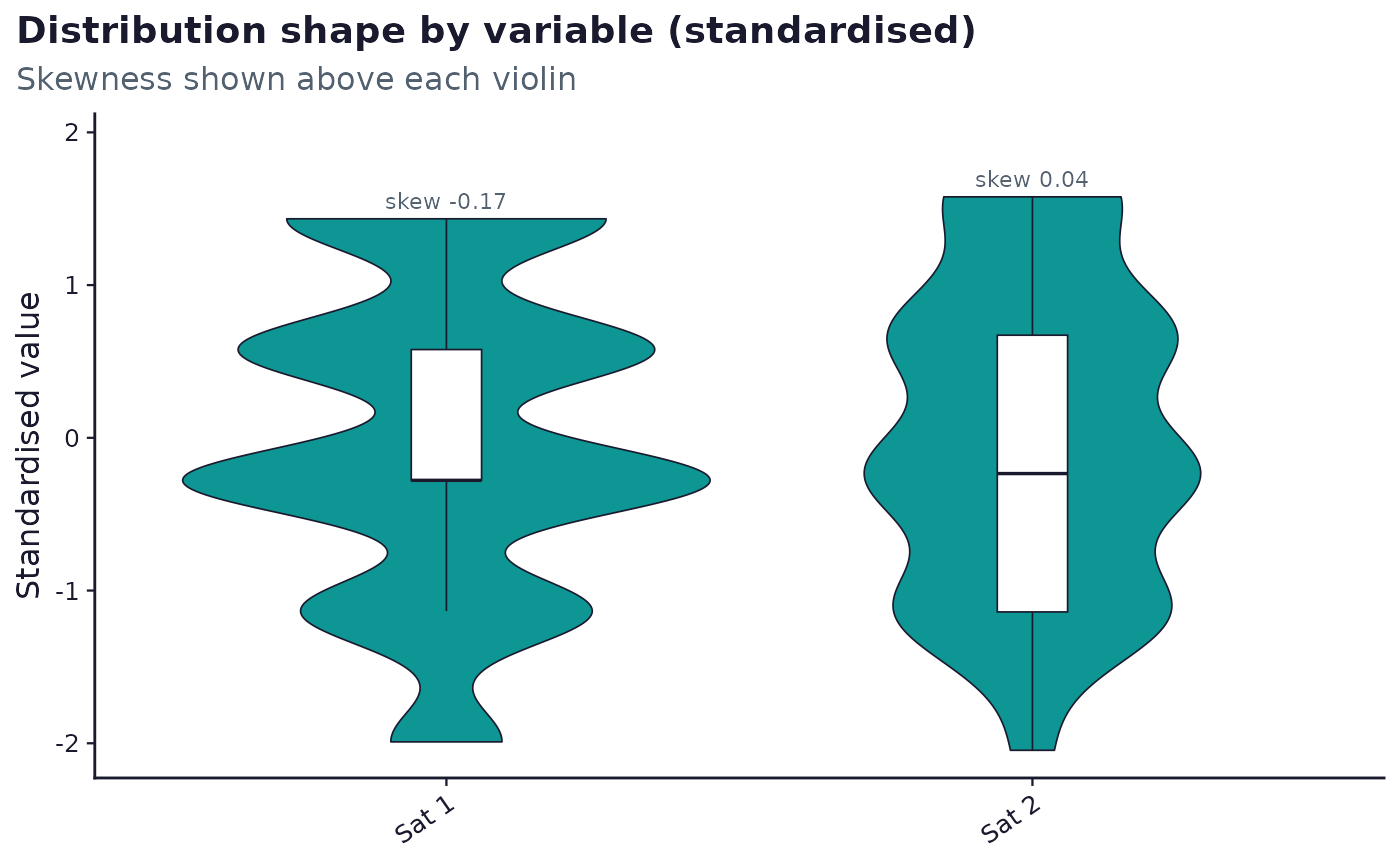
One violin per variable in a descriptives_report() table, built from
the underlying response data rather than from the summary skewness and
kurtosis numbers, so the reader sees the actual shape (asymmetry,
multimodality, tails) instead of reading it off a bar height. Each
variable is standardised (z-scored) before plotting so variables on
different original scales (a 5-point Likert item next to a 0-100 slider)
share one comparable y-axis. Standardising is a linear transform and does
not change skewness. Each violin's subtitle-free panel keeps the
variable's skewness value in its axis label. Grouped descriptives_report()
output (one row per variable per split_by group) is faceted by group.
Usage
sframe_plot_descriptives(x, data, palette = c("web", "print"))Arguments
- x
An
sframe_descriptives_reportobject fromdescriptives_report().- data
The same data.frame passed to
descriptives_report(). Required:xonly carries the summary table, not the raw values the violins need.- palette
One of
"web"or"print". Seesframe_brand().
Examples
# \donttest{
if (requireNamespace("ggplot2", quietly = TRUE)) {
demo <- sframe_demo_data()
dr <- descriptives_report(demo$responses, variables = c("sat_1", "sat_2"))
sframe_plot_descriptives(dr, demo$responses)
}
 # }
# }