
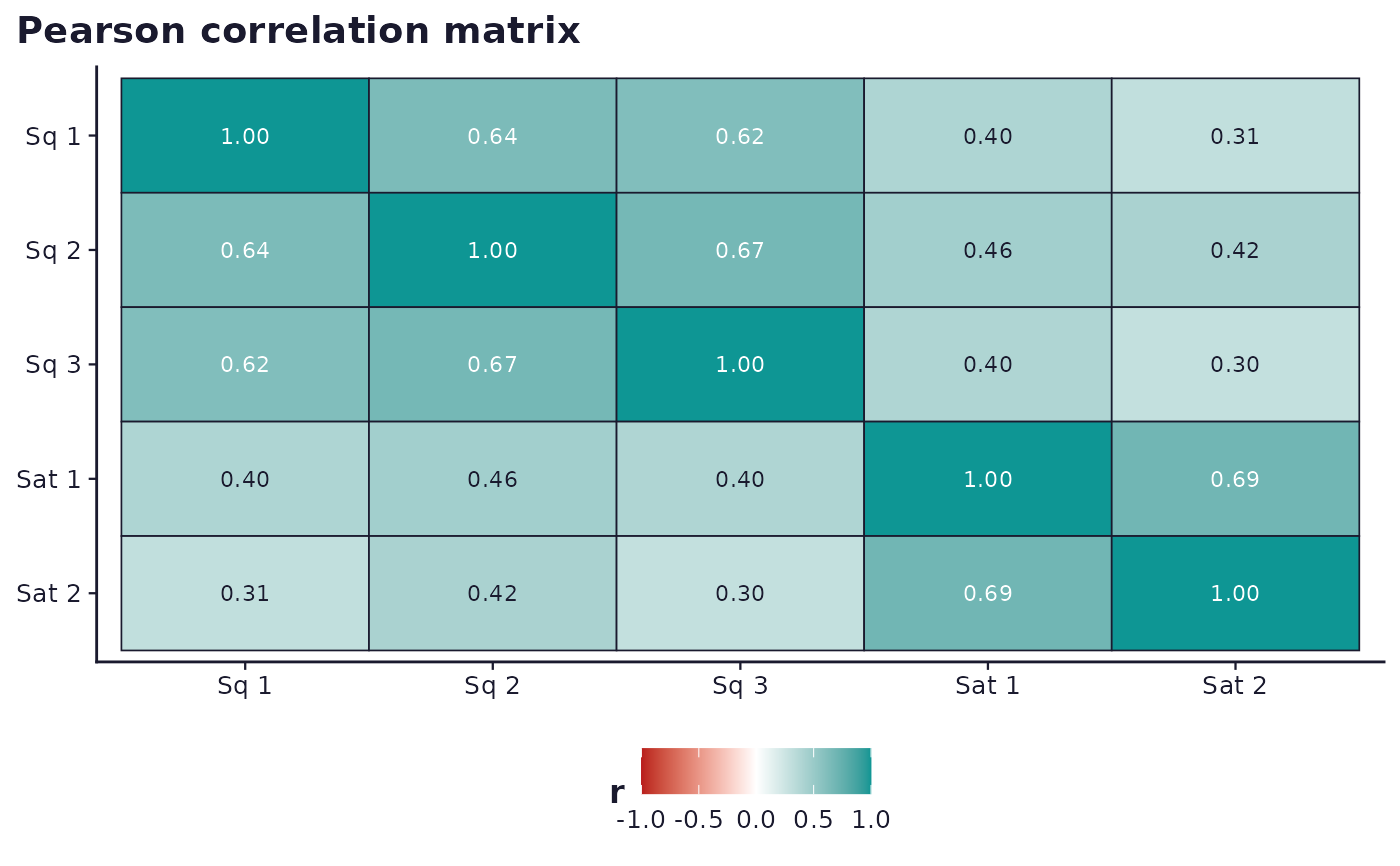
Computes and plots a full pairwise correlation matrix, independent of
run_analysis_plan()'s pairwise correlation_pearson/_spearman/
_kendall runners (which plot one variable pair at a time via
sframe_plot_correlation()). Useful directly, and as the visual
companion to validity_report()'s discriminant-validity checks.
Usage
sframe_plot_correlation_matrix(
  data,
  vars,
  method = "pearson",
  palette = c("web", "print")
)Examples
# \donttest{
if (requireNamespace("ggplot2", quietly = TRUE)) {
demo <- sframe_demo_data()
sframe_plot_correlation_matrix(demo$responses,
c("sq_1", "sq_2", "sq_3", "sat_1", "sat_2"))
}
 # }
# }