
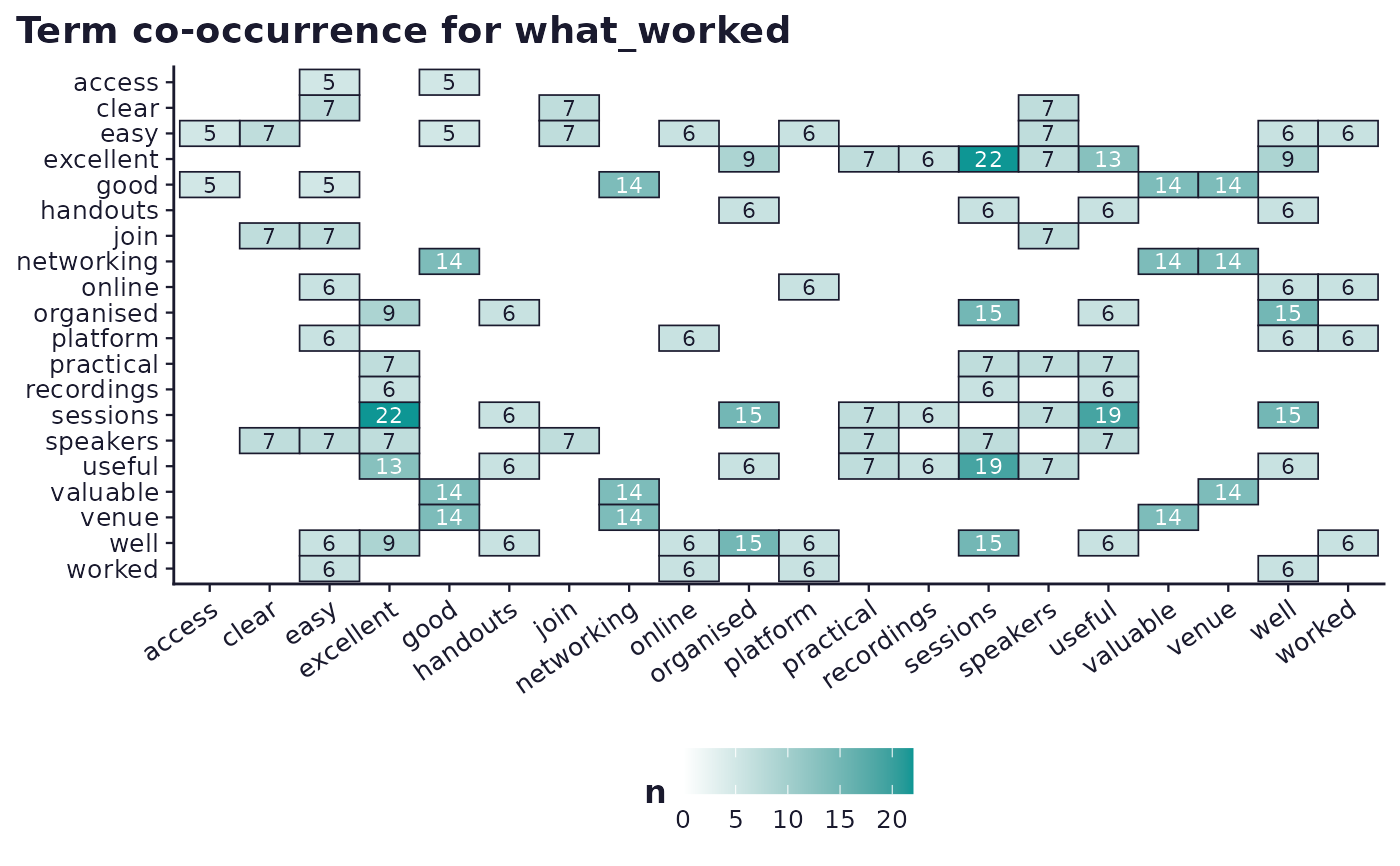
Tile heatmap of pairwise within-response term co-occurrence counts for a
co_occurrence result. The result's edge list (term_a, term_b, n)
is pivoted into a full symmetric term-by-term grid before plotting, so
each pair's tile appears twice, once on either side of the diagonal, the
way the other tile heatmaps in this file (sframe_plot_correlation_matrix(),
sframe_plot_efa_loadings()) read as a full grid rather than a triangle.
Usage
sframe_plot_cooccurrence(result, palette = c("web", "print"))Arguments
- result
A
co_occurrenceresult list fromrun_analysis_plan().- palette
One of
"web"or"print". Seesframe_brand().
Examples
# \donttest{
if (requireNamespace("ggplot2", quietly = TRUE)) {
demo <- sframe_demo("open_text")
res <- run_analysis_plan(demo$responses, demo$instrument)
sframe_plot_cooccurrence(res$RQ4)
}
#> Warning: K=2 is equivalent to a unidimensional scaling model which you may prefer.
 # }
# }