
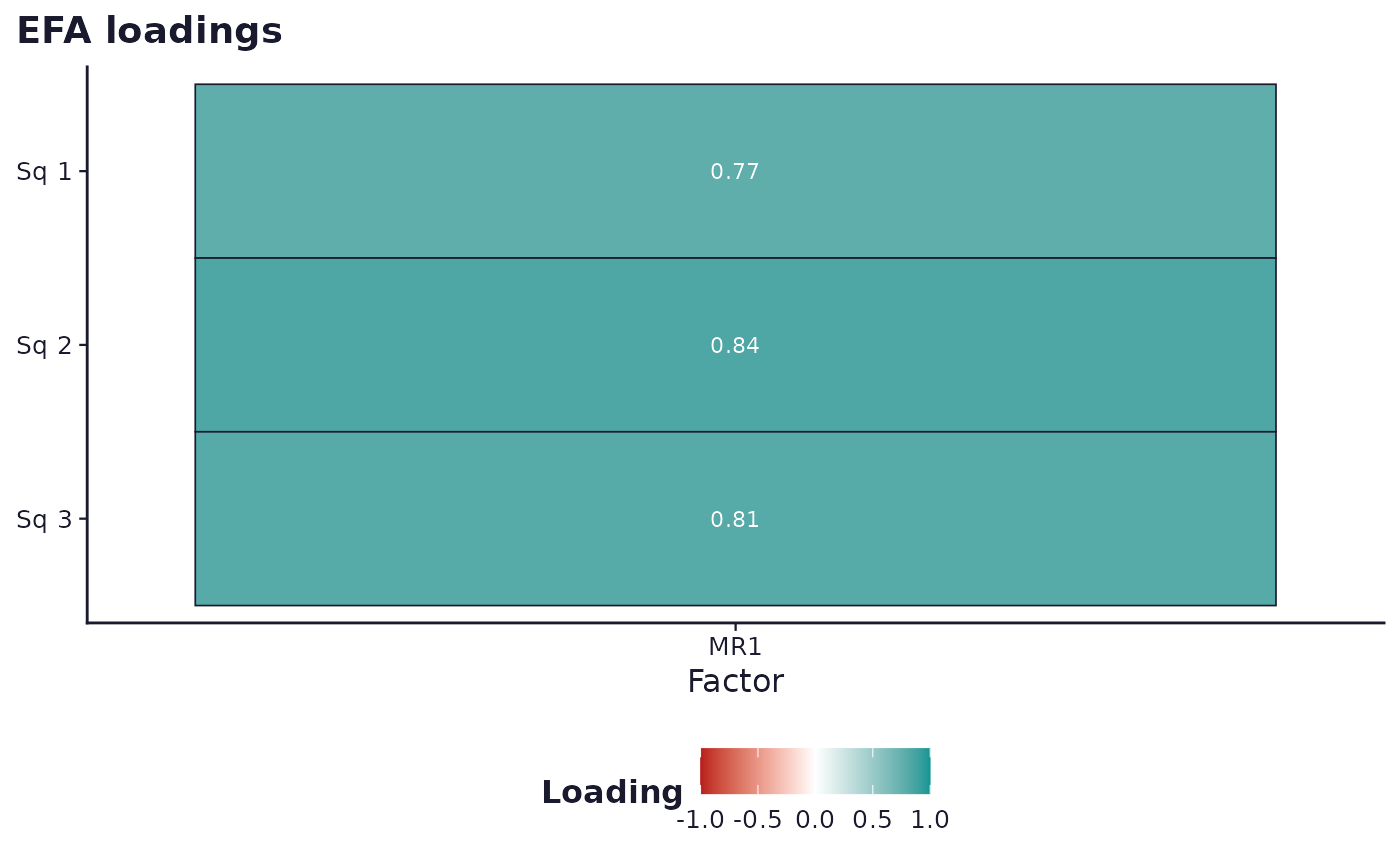
Loadings heatmap from a fitted EFA solution
Usage
sframe_plot_efa_loadings(x, palette = c("web", "print"))Arguments
- x
An
sframe_efa_solutionobject fromefa_solution().- palette
One of
"web"(diverging red/teal gradient) or"print"(white-to-black gradient by magnitude, with sign conveyed by the printed label rather than colour, so it stays legible in monochrome). Seesframe_brand().
Examples
# \donttest{
if (requireNamespace("ggplot2", quietly = TRUE) &&
requireNamespace("psych", quietly = TRUE)) {
demo <- sframe_demo_data()
fit <- efa_solution(demo$responses, demo$instrument,
scales = "service_quality", nfactors = 1)
sframe_plot_efa_loadings(fit)
}
 # }
# }