
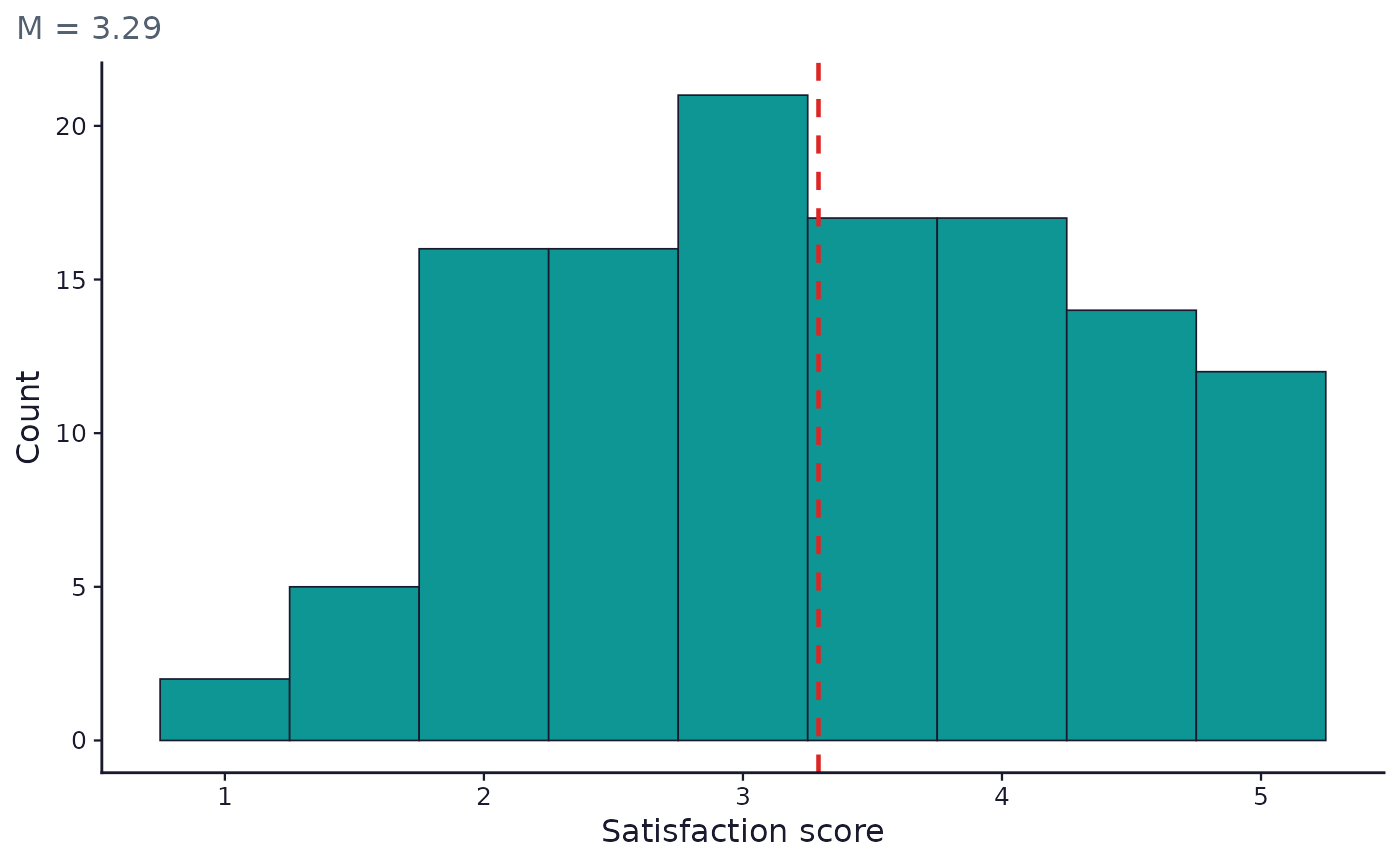
Scale score distribution chart, ggplot2 equivalent of the dashboard panel
Source:R/plots.R
sframe_plot_scale_chart.RdSame sharing rationale as sframe_plot_item_chart().
Usage
sframe_plot_scale_chart(scores, label, palette = c("web", "print"))Examples
# \donttest{
if (requireNamespace("ggplot2", quietly = TRUE)) {
demo <- sframe_demo_data()
scored <- score_scales(demo$responses, demo$instrument)
sframe_plot_scale_chart(scored$satisfaction, "Satisfaction")
}
 # }
# }