
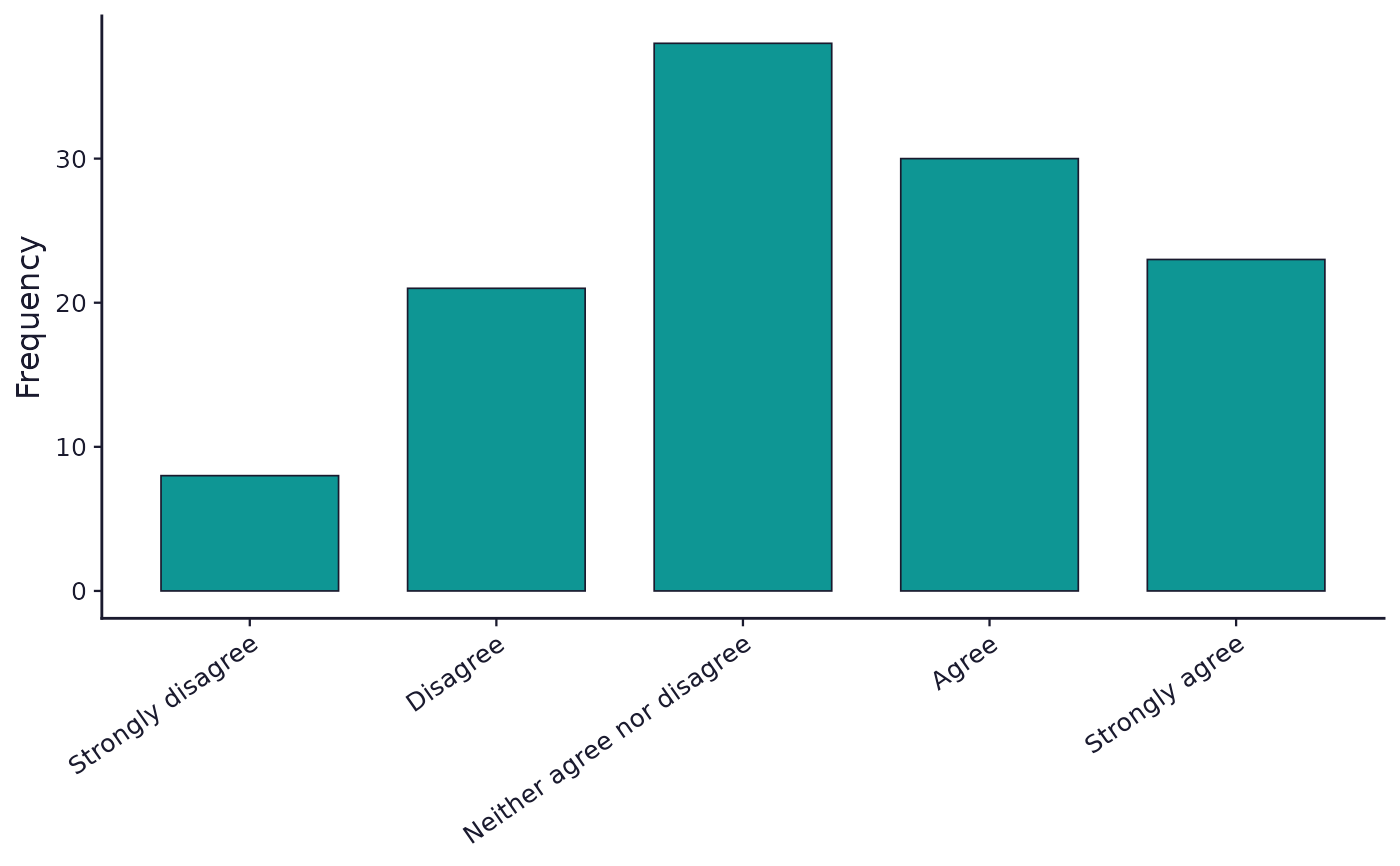
Draws how one item was answered, as the dashboard and SurveyStudio panels
show it. It returns NULL where it has nothing to draw, so a caller can
fall back to its own chart.
Usage
sframe_plot_item_chart(
  item,
  col_data,
  choice_set = NULL,
  palette = c("web", "print")
)Details
Shared by launch_dashboard() (inst/shiny/dashboard/app.R) and the
SurveyStudio dashboard tab (inst/shiny/app.R), which otherwise
duplicated this base-graphics chart. Callers fall back to their own base
graphics when this returns NULL (ggplot2 not installed, unsupported
item type, or no data), so the dashboard keeps working without ggplot2.
Examples
# \donttest{
if (requireNamespace("ggplot2", quietly = TRUE)) {
demo <- sframe_demo_data()
item <- Filter(function(i) i$id == "sat_1", demo$instrument$items)[[1]]
cs <- Filter(function(c) c$id == item$choice_set, demo$instrument$choices)[[1]]
sframe_plot_item_chart(item, demo$responses$sat_1, cs)
}
 # }
# }