
Several separate Likert items that make up one sf_scale() (unlike a
"matrix" item's rows, which are one question) are, by default, each
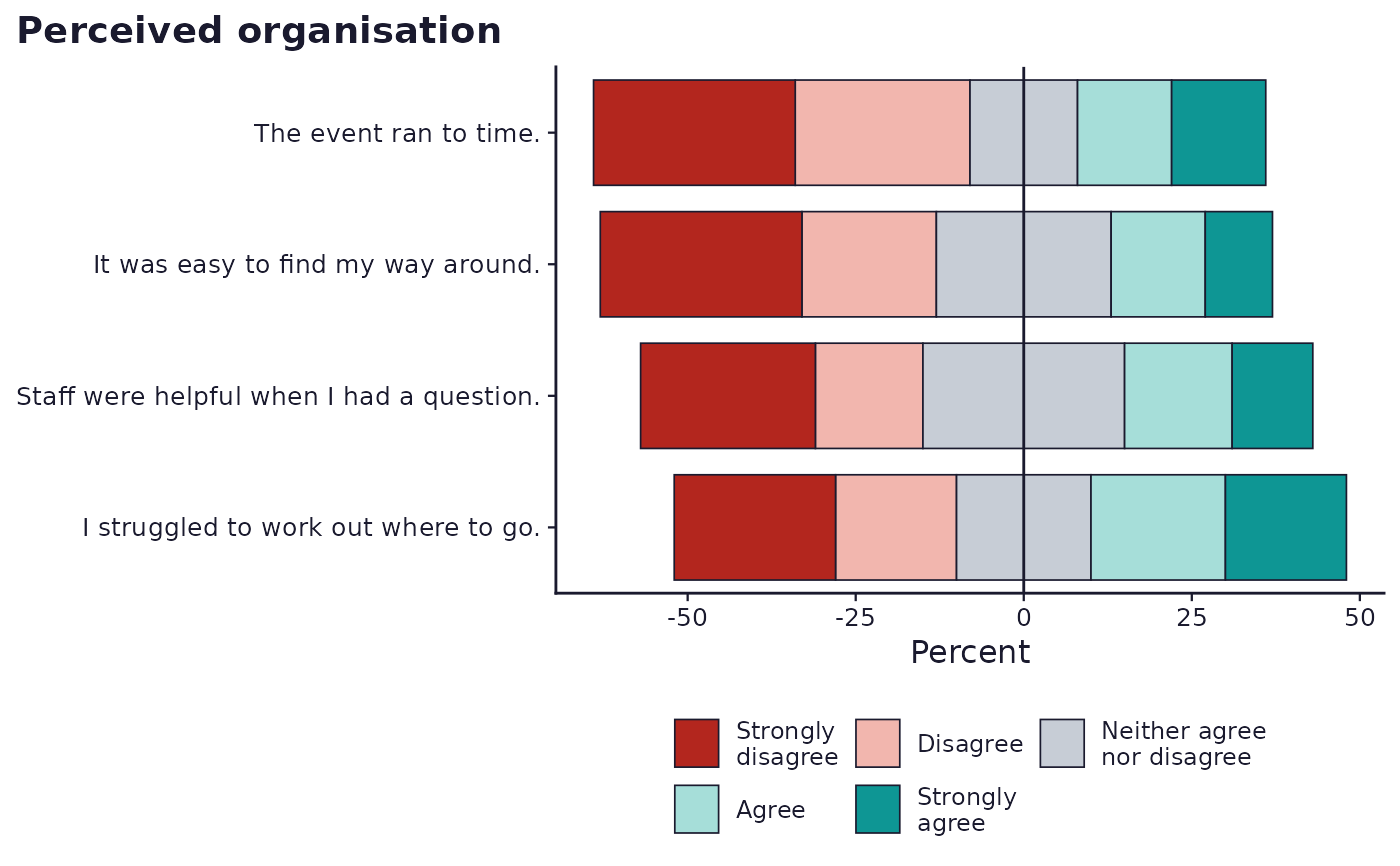
reported as their own single-item diverging chart. That scatters a
related batch of items (a satisfaction scale's 2-3 items, say) across
several charts instead of showing them the way a Likert matrix or a
typical multi-item satisfaction grid is reported: one grouped chart, one
diverging bar per item, sharing an x scale and a legend. Applies only
when every item in the scale shares the same choice set. Scales that mix
response scales fall back to one chart per item.
Usage
sframe_plot_likert_scale(
  items,
  data,
  choice_set,
  title,
  palette = c("web", "print")
)Examples
# \donttest{
if (requireNamespace("ggplot2", quietly = TRUE)) {
demo <- sframe_demo("likert_scale")
groups <- sframe_likert_scale_groups(demo$instrument)
g <- groups[["organisation"]]
sframe_plot_likert_scale(g$items, demo$responses, g$choice_set, g$title)
}
 # }
# }