
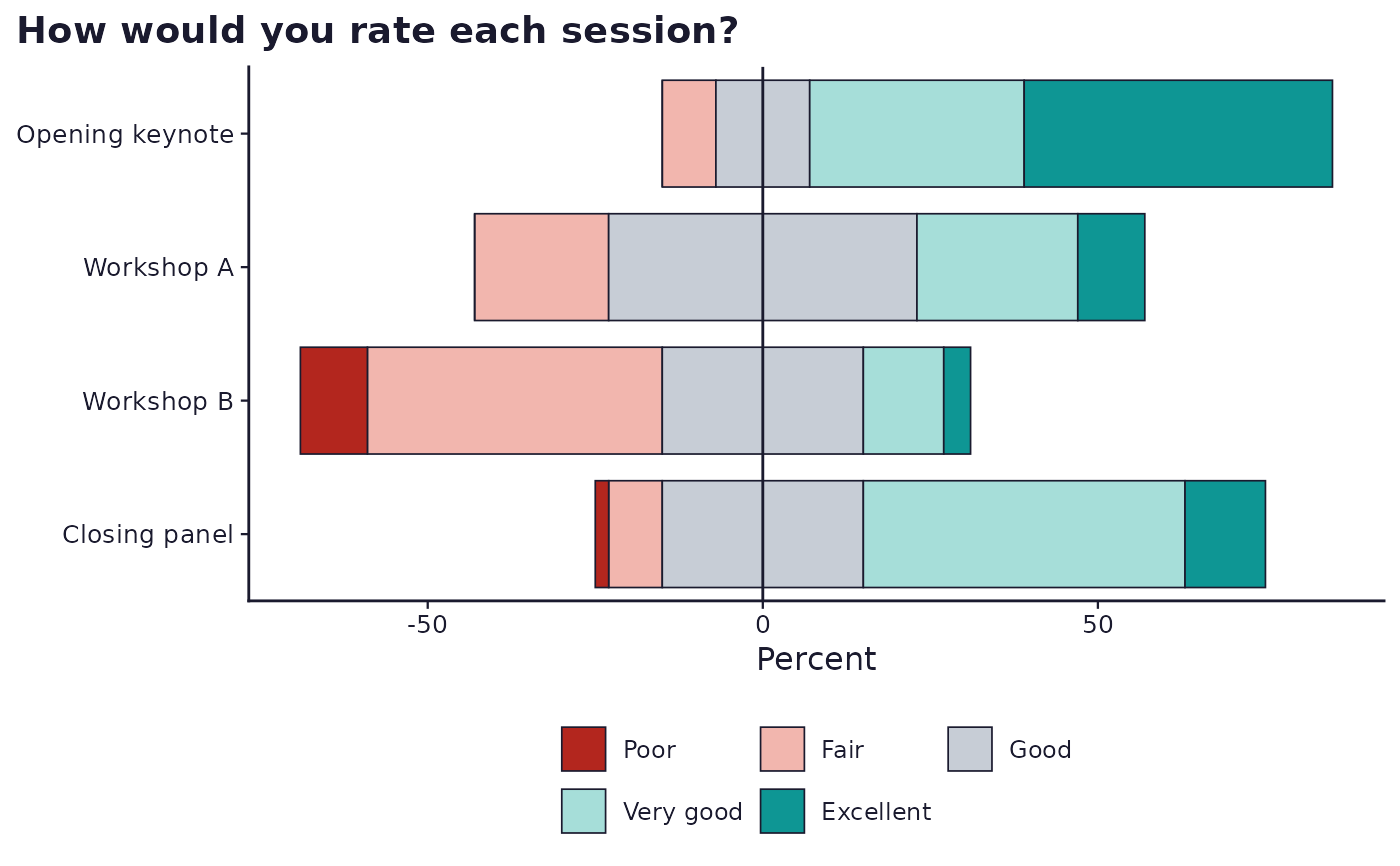
A matrix question asks several rows against one shared response scale
(a "grid" of Likert items). Plotting each row as its own separate
sframe_draw_likert_diverging() chart loses the grouping the question
was designed with, so this draws every row as one diverging bar inside a
single chart, sharing one x scale and one legend, the standard way a
Likert matrix is reported (compare a typical multi-item satisfaction
grid). Same diverging-stack convention as the single-item chart: the
middle category of an odd-length scale is neutral and split evenly
across the zero line, and colour saturation increases toward each pole.
Usage
sframe_plot_likert_matrix(item, data, choice_set, palette = c("web", "print"))Arguments
- item
A
"matrix"sframe item, withmatrix_items(the row labels) and achoice_setnaming the shared response scale.- data
The response data.frame, with one expanded
<item id>__<row label>column per matrix row, as produced byread_responses().- choice_set
The item's choice set object (
values,labels), typically looked up frominstrument$choicesbyitem$choice_set.- palette
One of
"web"or"print". Seesframe_brand().
Examples
# \donttest{
if (requireNamespace("ggplot2", quietly = TRUE)) {
demo <- sframe_demo("matrix_likert")
item <- Filter(function(i) i$type == "matrix", demo$instrument$items)[[1]]
cs <- Filter(function(c) c$id == item$choice_set, demo$instrument$choices)[[1]]
sframe_plot_likert_matrix(item, demo$responses, cs)
}
 # }
# }