
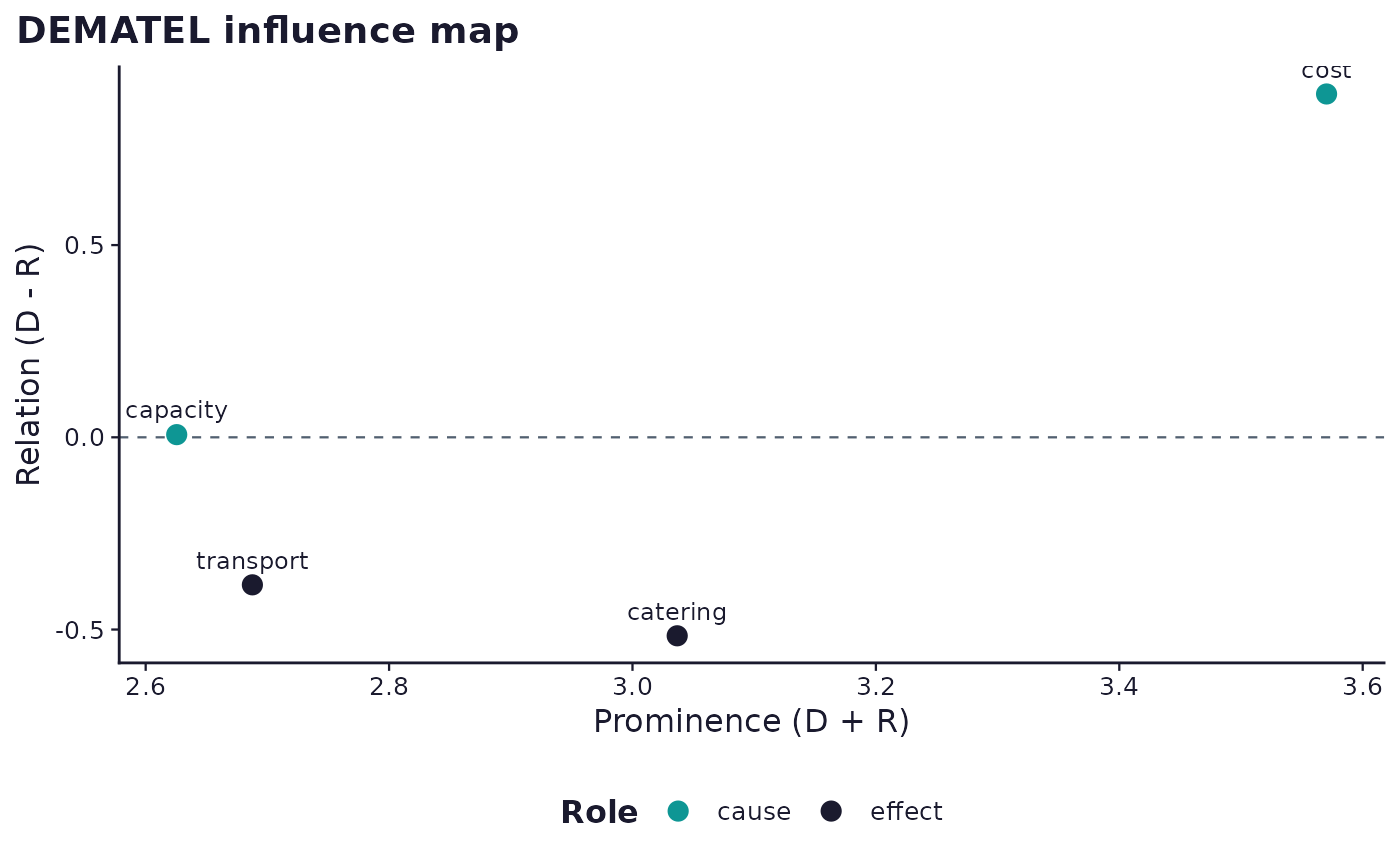
Prominence-relation scatter for a DEMATEL result
Source:R/decision_dematel.R
sframe_plot_dematel_influence.RdThe dedicated DEMATEL chart: one point per criterion, prominence (D + R)
on x and relation (D - R) on y, with a horizontal quadrant line at
relation = 0 separating causes (above) from effects (below). This is
deliberately a different shape from sframe_plot_decision_ranking():
DEMATEL classifies criteria on two axes rather than producing a single
ranked score, so a ranking bar chart would misrepresent it.
Usage
sframe_plot_dematel_influence(result, palette = c("web", "print"))Arguments
- result
A
dematel-family result list fromrun_analysis_plan()orsframe_run_dematel(), carryingprominence,relation, andcriteria.- palette
One of
"web"or"print". Seesframe_brand().
Examples
# \donttest{
if (requireNamespace("ggplot2", quietly = TRUE)) {
demo <- sframe_demo("mcdm_choice")
res <- run_analysis_plan(demo$responses, demo$instrument)
sframe_plot_dematel_influence(res$RQ3)
}
 # }
# }