
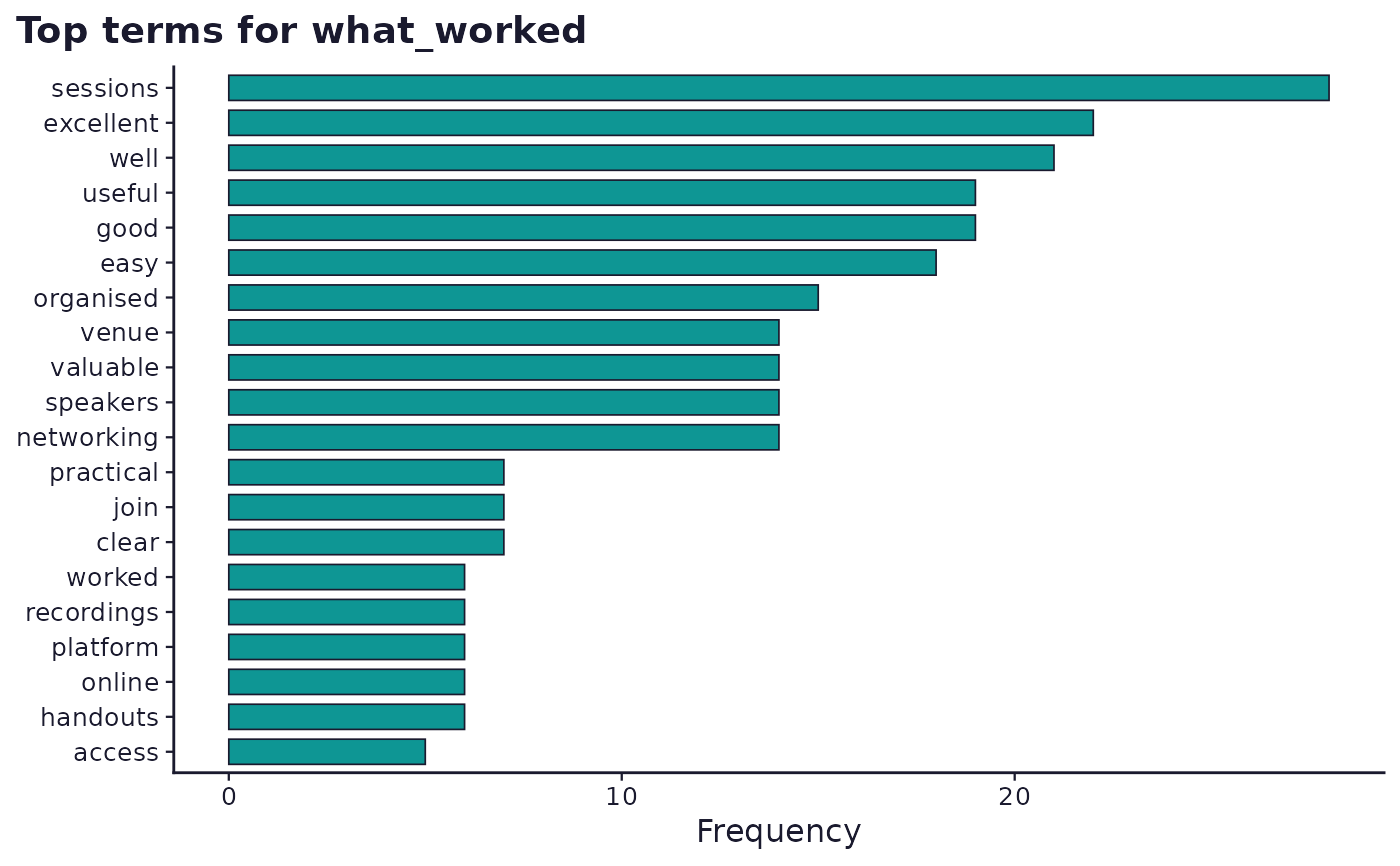
Top terms from a term_freq result as a horizontal bar chart, or a word
cloud when result$options$wordcloud is TRUE (opt-in, default
FALSE). Facets by group when the result carries a group role
(todo_text_analysis.md section 1a).
Usage
sframe_plot_term_frequency(result, palette = c("web", "print"))Arguments
- result
A
term_freqresult list fromrun_analysis_plan().- palette
One of
"web"or"print". Seesframe_brand().
Examples
# \donttest{
if (requireNamespace("ggplot2", quietly = TRUE)) {
demo <- sframe_demo("open_text")
res <- run_analysis_plan(demo$responses, demo$instrument)
sframe_plot_term_frequency(res$RQ1)
}
#> Warning: K=2 is equivalent to a unidimensional scaling model which you may prefer.
 # }
# }