
Regression diagnostic plots for a regression_linear result
Source:R/plots.R
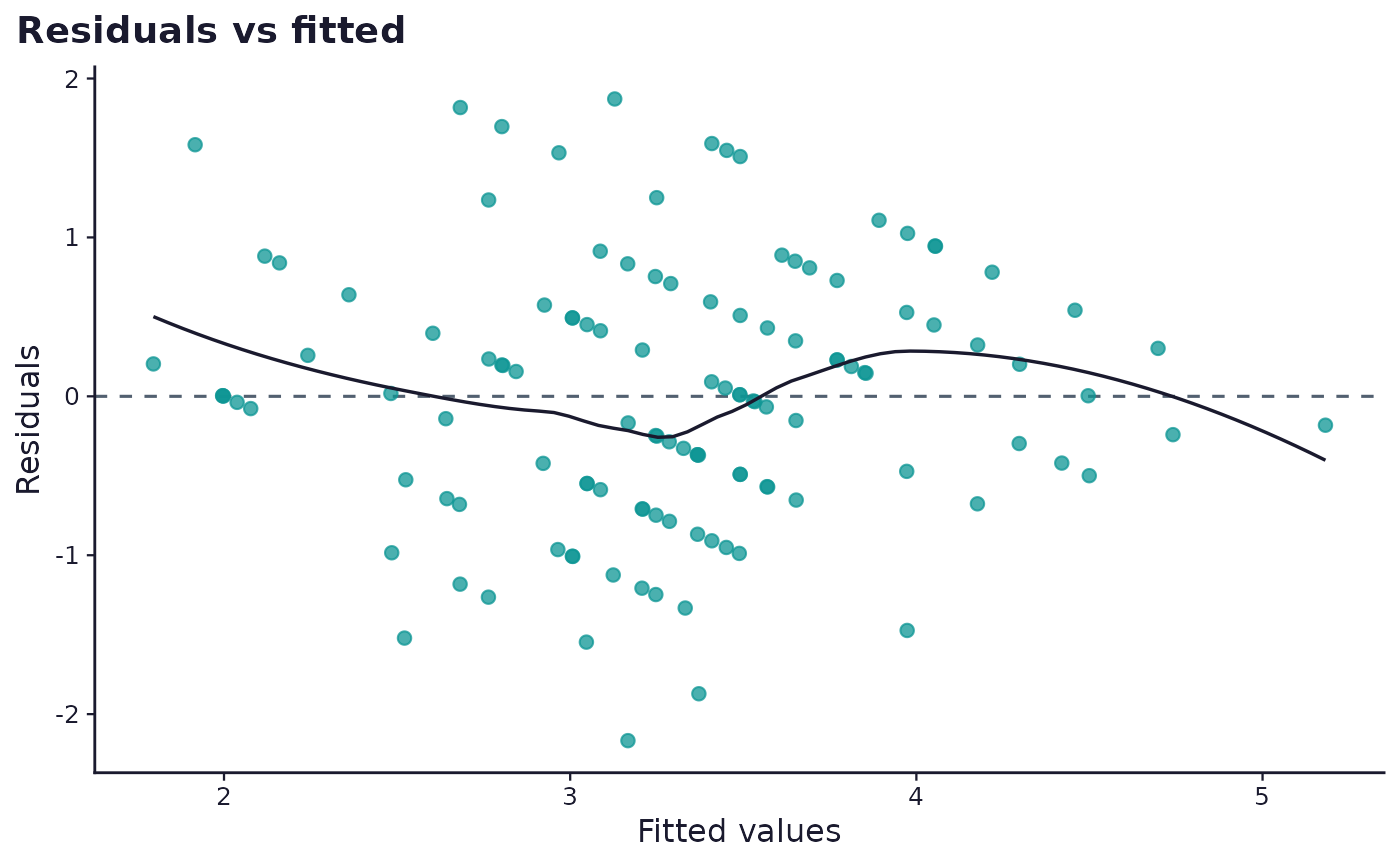
sframe_plot_regression_diagnostics.RdThe four standard diagnostic panels (residuals vs fitted, normal Q-Q,
scale-location, residuals vs leverage), built from the plain data frame
run_analysis_plan() attaches to a regression_linear result rather than
the lm object itself, so the result stays JSON-serialisable.
Usage
sframe_plot_regression_diagnostics(result, palette = c("web", "print"))Arguments
- result
A
regression_linearresult list containing adiagnosticsdata frame (as produced internally byrun_analysis_plan()).- palette
One of
"web"or"print". Seesframe_brand().
Value
A named list of four ggplot2 objects (residuals_fitted, qq,
scale_location, leverage), or NULL if diagnostics are unavailable.
Examples
# \donttest{
if (requireNamespace("ggplot2", quietly = TRUE)) {
demo <- sframe_demo_data()
res <- run_analysis_plan(demo$responses, demo$instrument)
panels <- sframe_plot_regression_diagnostics(res$rq_predict_sat)
panels$residuals_fitted
}
 # }
# }