
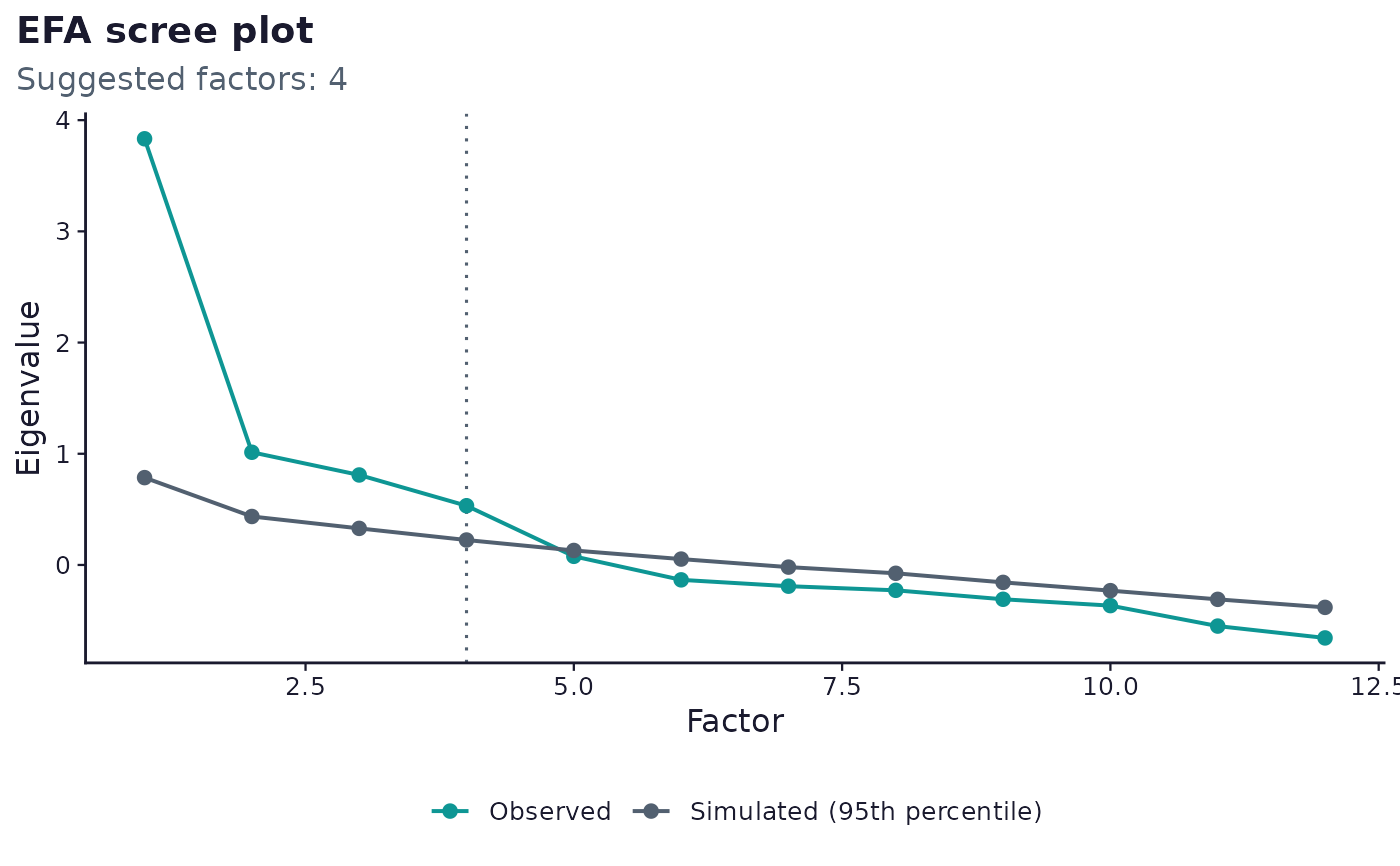
Plots the parallel-analysis eigenvalues from efa_report() (both the
observed factor-analysis eigenvalues and the simulated comparison line),
with the suggested factor count marked.
Usage
sframe_plot_efa_scree(x, palette = c("web", "print"))Arguments
- x
An
sframe_efa_reportobject fromefa_report().- palette
One of
"web"or"print". Seesframe_brand().
Examples
# \donttest{
if (requireNamespace("ggplot2", quietly = TRUE) &&
requireNamespace("psych", quietly = TRUE)) {
demo <- sframe_demo_data()
er <- efa_report(demo$responses, demo$instrument)
sframe_plot_efa_scree(er)
}
 # }
# }