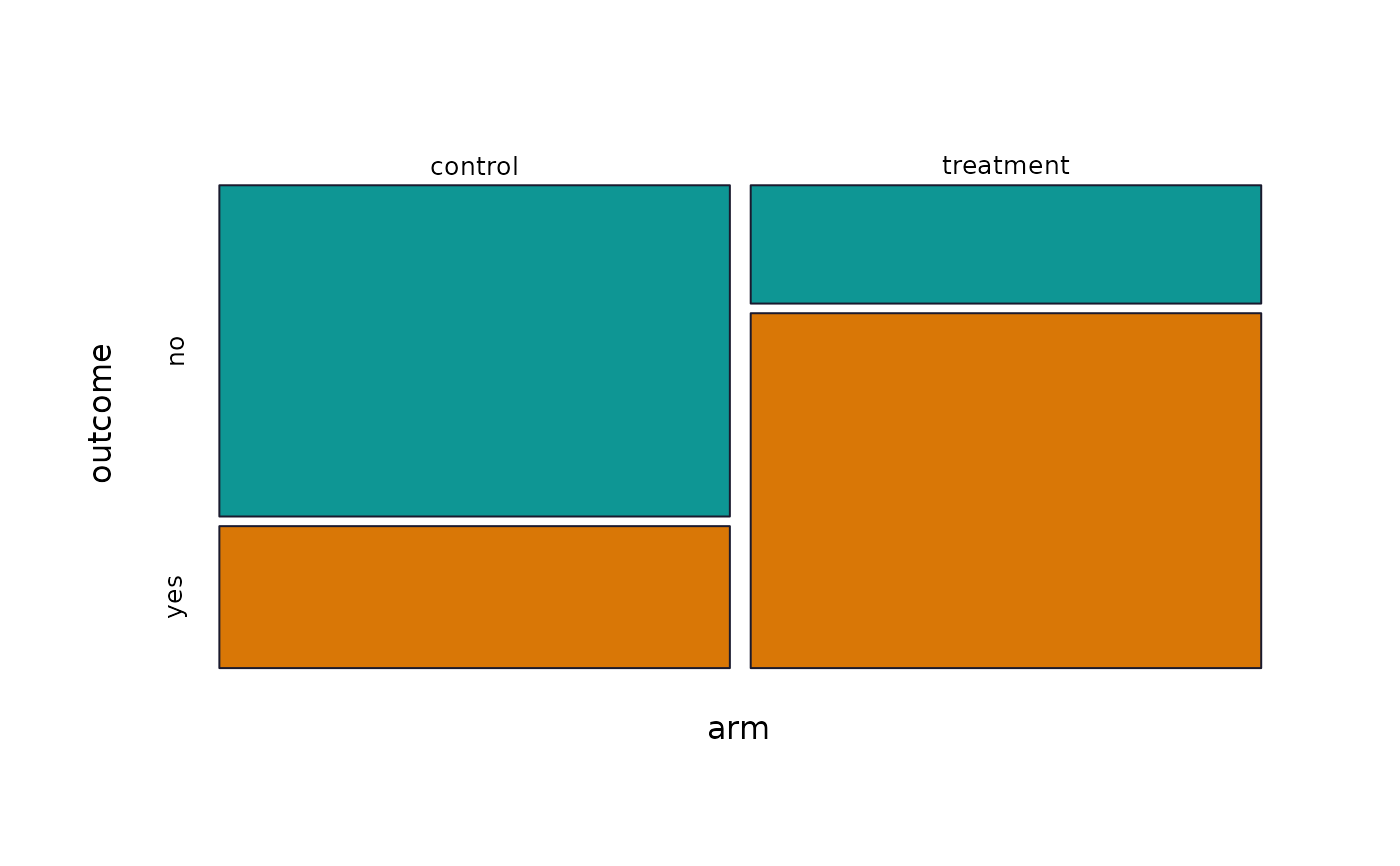
Base-graphics mosaic plot (via graphics::mosaicplot()), matching the
existing base-graphics precedent in this file
(sframe_draw_likert_diverging()) so it renders without ggplot2. An
alternative view of the same crosstab data
sframe_plot_crosstab() renders as a grouped bar. Use whichever reads
better for the table's shape (mosaic scales better to unbalanced group
sizes).
Usage
sframe_draw_mosaic(result, palette = c("web", "print"))Examples
instr <- sf_instrument("Crosstab demo", components = list(
  sf_item("arm", "Arm", type = "text"),
  sf_item("outcome", "Outcome", type = "text")
))
sf_plan(instr) <- list(list(
  id = "RQ1", research_question = "Does the outcome differ by arm?",
  family = "categorical", method = "chi_square",
  roles = list(row = "arm", column = "outcome")
))

responses <- data.frame(
  arm     = rep(c("control", "treatment"), each = 20),
  outcome = c(rep(c("yes", "no"), c(6, 14)), rep(c("yes", "no"), c(15, 5)))
)
res <- run_analysis_plan(responses, instr)
sframe_draw_mosaic(res$RQ1)